

It is often the case that for many entrepreneurs, executives and inheritors, a large portion of wealth is confined to a single stock. Unfortunately, for many investors, the true riskiness of a concentrated position is not understood until it is too late.
This writing is aimed to help investors understand and manage the risk of holding concentrated stock positions, and is organized into two sections:
1. Defining, Measuring and Interpreting Concentrated Position Risk, and
2. Risk Management Strategies for Concentrated Positions.
The Defining, Measuring and Interpreting Concentrated Position Risk section discusses traditional tenets of modern portfolio theory – namely the benefits of diversification. Maximum drawdown is introduced as another (perhaps more intuitive) way to think of investment risk. This section also highlights psychological factors associated with concentrated positions, and more broadly, investor decision-making. Finally, the Risk Management Strategies for Concentrated Positions section highlights six distinct strategies that can be employed to reduce risk.
An Important Caveat about Measuring Risk
An inherent problem with many risk measurement techniques is that most simply assume the past will repeat in the future. This assumption is analogous to military planners assuming the next war will be just like the last, and creates a disconnect between practice and theory.
From a practical investment management perspective, we are strong advocates of techniques designed to identify real-time risks, as opposed to those relying on the past-performance assumption. From an educational perspective, we think measures that do rely on the past-performance assumption, such as those addressed in this paper, are more effective at articulating foundational investment risk concepts.
1. Defining, Measuring and Interpreting Concentrated Position Risk
Fundamentally, portfolio management concerns the tradeoff between risk and reward. Generally, tweaking a portfolio to increase potential return will necessarily result in increased risk. Reducing portfolio risk, however, does not necessarily result in a sacrifice of future expected return.
Type of Risk
Not all risk is created equal. Investment risk can be categorized in one of two types: systematic and unsystematic. The distinction is not merely semantic.
Systematic risk cannot be “diversified away.” Unsystematic risk, however, can. A well-diversified portfolio will have the same amount of systematic risk as an undiversified portfolio; but will have lower unsystematic and total risk, all else equal.
The chart below illustrates the basic relationship between the number of holdings and portfolio risk1:
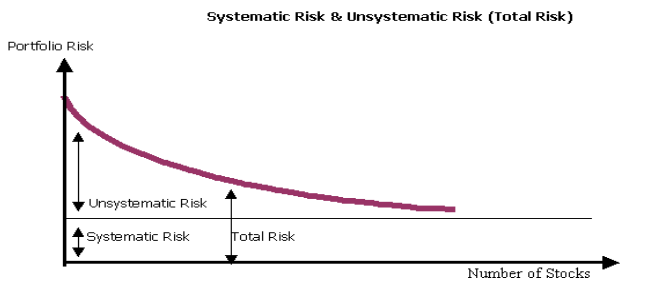
Note that the relationship between risk and number of stocks is not linear. In other words, the diversification benefit of going from one to two stocks would be greater than going from 99 to 100 stocks (all else equal).
Defining & Measuring Risk
Many investors are familiar with the term “standard deviation” – the (overwhelmingly) most common measure of investment risk. Few investors (and arguably not enough investment professionals) have a true understanding of what this term represents.
While standard deviation has application in several areas of the investment management field, it often falls short as a means to articulate “risk” to common investors. Descriptions of volatility, such as “the standard deviation of SAT scores at Springfield High School is 80 points,” or “the standard deviation of stock XYZ is 23.4 percent,” can be difficult to fully conceptualize, even for the most mathematically-inclined.
A Different Perspective of Risk: Maximum Drawdown
The maximum drawdown measure provides a more intuitive measure of risk. Maximum drawdown measures the peak-to-trough difference over a specific period of time.
For example: you buy Company XYZ on January 1, 2011 for $100/share. The holding (measurement) period is one year. Performance history for XYZ in 2011 is as follows:
| Date | Description | Share Price |
|---|---|---|
| January 1, 2011 | Initial Price | $100 |
| May 10, 2011 | Highest Price | $130 |
| October 21, 2011 | Lowest Price | $60 |
| December 31, 2011 | Ending Price | $110 |
The maximum drawdown in this scenario is $70 – which is calculated simply by subtracting the lowest price point ($60) that comes after the highest price point ($130)1.
The main benefit of the maximum drawdown metric is that it provides investors with a more intuitive understanding of risk, compared to other risk metrics (such as semi-standard deviation, value-at-risk, et cetera). Investors often use the investment’s high price as a basis for measuring loss. In the above example, XYZ actually appreciates 10 percent in 2011. However, many investors would “feel” as if they lost money, because XYZ peaked at $130/share.
A Note on Value-at-Risk (VaR)
Many practitioners believe that the approaches discussed thus far, (1) standard deviation and (2) maximum drawdown, are overly simplistic. Another approach to measuring risk, Value-at-Risk (VaR), attempts to combine probability, magnitude and timing into a single metric. As compared to standard deviation and maximum drawdown, the computation and explanation of VaR is more technical in nature, and is discussed further in Appendix I: A Primer on Value-at-Risk (VaR).
Safety in Quality?
Many investors holding concentrated positions in the largest, well-established, most-reputable companies feel somewhat sheltered from the risks of holding a concentrated position.
Fortune Magazine publishes annually1 its America’s Most Admired Companies list. Companies are ranked based on qualitative reputational scores that include criteria such as perceived future investment value, employee talent, and management quality2. In 2002, this list was comprised of the following ten companies (Stein, 2003):
| Fortune’s 2002 America’s Most Admired | |||
|---|---|---|---|
| 1. General Electric | 4. Microsoft | 7. Johnson & Johnson | 10. Intel Corp |
| 2. Southwest Airlines | 5. Berkshire Hathaway | 8. FedEx | |
| 3. Wal-Mart | 6. Home Depot | 9. Citigroup | |
We then measure the maximum drawdown of these companies over the subsequent decade. In the table below, Paper Loss is calculated assuming an investor has a $10 Million stake in the stock at its highest point.
| Company | 2002 Rank | Max Drawdown | Paper Loss of $10MM |
|---|---|---|---|
| Citigroup | 9 | -96.1% | ($9,610,000) |
| General Electronic | 1 | -76.4% | ($7,640,000) |
| Southwest Airlines | 2 | -69.3% | ($6,930,000) | FedEx | 8 | -63.0% | ($6,300,000) | Intel | 10 | -58.3% | ($5,830,000) | Berkshire Hathaway | 5 | -55.7% | ($5,570,000) | Microsoft | 4 | -54.2% | ($4,420,000) | Home Depot | 6 | -46.7% | ($4,670,000) | Diversified Portfolio | N/A | -32.6% | ($3,260,000) | Johnson & Johnson | 7 | -28.9% | ($2,890,000) | Walmart | 3 | -26.1% | ($2,610,000) |
To reiterate, these companies were not recent basement start-up companies. This list is composed of some of the largest and (seemingly) stable companies in the United States. These were not merely admired companies; but rather, the 10 most-admired of the approximately 6,500 US-based and publically-traded companies in 20021. No company, regardless of how “admired” it is, is immune to risk.
This example highlights two common problems to investors with concentrated positions:
1. Investors themselves tend to overestimate their ability to assess a company’s quality; and
2. While long-run prices are more determined by underlying business fundamentals, short-run prices can stray drastically from “justified” prices for reasons unrelated to company performance
The root cause of these problems is not found in traditional finance or economics; but rather, psychology.
Psychological Factors
Circumstances surrounding concentrated stock investments cannot be completely explained by numbers, charts and graphs. Emotional and psychological issues play important roles to investors owning concentrated positions.
In some cases, a concentrated stock holding may bear the investors family name. In other cases, the position may have been inherited or acquired from a loved one. In most cases, investors have strong emotional attachments to concentrated positions. Investors have a natural affinity for a company that served as a source of great wealth. Three psychological themes that commonly affect investors (Shefrin, 2010) of concentrated positions include:
Adaptive Expectations / Representativeness: Many investors use past performance as a basis for future performance expectations. Most investors possessing concentration positions have seen these holdings, at some point, experience a period of above-average (or extraordinary) growth. Investors believe that this level of performance will continue indefinitely – or at least at a level higher than that based on rational forecasts.
Overconfidence: Confidence, in most aspects of life, is a valuable trait that is usually abundant in successful entrepreneurs and executives. Unchecked, confidence can breed overconfidence, leading to poor investment choices. Overconfidence usually results in a failure to understand the true risk of the concentrated position. Simply put, an investor may be overconfident in the future performance of the concentrated position because of this innate personality trait.
Incentives & Behavioral Biases: Understanding incentive structures can help identify potential biases. Company management, as well as some sell-side analysts (working for investment banks with significant business relationships with the company) may be incentivized (both directly and indirectly) to predict better future performance for the company than what can reasonably be inferred using unbiased data. Investors holding concentrated positions often base their future expectations, at least partially, on the opinions of management and sell-side analysts.
When considering options in dealing with concentrated positions, investors should attempt to remove the emotional component, and instead, analyze in a rational manner. Personal introspection and emotional reflection can be every bit as important as understanding the quantitative, technical side of concentrated stock risk.
2. Risk Management Strategies for Concentrated Positions
Inability to identify or act upon concentrated stock risk has led to the loss of many fortunes. Fortunately, several strategies are available to help manage the risk associated with concentrated positions (Brunel, 2010).
Most strategies must contend with a fundamental risk-reduction and tax efficiency. In other words, a strategy that is more effective at reducing unsystematic risk is often less tax-efficient.
The “best” strategy considers factors specific to the investor. What other assets does the investor own, and in what quantities? Is the investor subject to legal constraints concerning trading activity of the underlying position? Is the investor considered an “insider?” What is the investor’s attitude towards risk? What are the investor’s long-term financial and estate-planning goals? Five strategies for dealing with concentrated positions are discussed in the section:
1. Outright Sale of Position
2. Gradual Sale of Position
3. Hedging Strategies
4. Exchange Funds
5. Completion Portfolios
1. Outright Sale of Position – Strategy executed by fully and immediately selling the entire concentrated position.
Advantages: Of all exit strategies, it is the simplest to execute. The unsystematic risk associated with the concentrated position is eliminated immediately upon sale.
Disadvantages: The outright sale of a concentrated position usually results in a large (and immediate) tax liability for the investor. As a result of this large tax liability, the reinvestment amount will be lower.
2. Gradual Sale of Position – Typically, either a predetermined percentage or dollar amount of the concentrated position is sold over several years. This strategy can be tailored to the specific tax-situation of the investor.
Advantages: Compared to an immediate outright sale, this strategy results in a lower current tax liability. Capital gains tax is deferred, spreading the burden over time.
Disadvantages: The investor retains more security-specific risk compared to the immediate outright sale. Proper diversification is not immediately achieved.
3. Hedging Strategies – An investor can utilize derivative products and strategies to reduce the security-specific risk. Differing hedging strategies offer differing benefits and drawbacks. Some of the more commonly used hedging strategies involve the use of options, shorts, monetization, and forward contracts. Some of these strategies are discussed further in Appendix II: Common Hedging Strategies.
A constructive sale – as defined within the Taxpayer Relief Act of 1997 – must be factored in the consideration of any hedging strategy. Dr. Mark Anson, an expert on derivative strategy taxation, suggests a constructive sale is made in the following circumstances (Anson, 1998):
- A short sale of the same or substantially identical property
- An offsetting notional principal contract with respect to the same or substantially identical property
- A futures or forward contract to deliver the same or substantially identical property
Advantages – Hedging strategies can provide near-perfect hedges at comparatively low costs. Tax efficiency is achieved, assuming the strategy is executed in accordance within the constructive-sale provision.
Disadvantages – Many investors are uncomfortable with the complexity of some hedging strategies. Moreover, some hedging strategies often do not work as designed in stressed market conditions (Black Friday in 1987, Russian Bond Event in 1998, et cetera).
4. Exchange Funds – A public exchange fund brings together numerous investors with concentrated positions. These positions are then “pooled” into an exchange fund, spreading risk amongst the fund’s investors.
Advantages: Contributing to a public exchange fund reduces unsystematic risk while deferring capital gains taxes.
Disadvantages: US law requires that investors enter a public exchange partnership for a minimum of seven years, making this option a poor choice for investors who value liquidity. Furthermore, the embedded tax liability for the investor is still tied to the original concentrated position – not the public exchange fund.
5. Completion Portfolio – This option is viable only if the investor has sufficient liquid assets in addition to the concentrated position. With the additional liquid assets, the investor purchases securities having low and/or negative correlation to the concentrated position. Combined, these positions serve to reduce total unsystematic risk to the investor. Typically, dividends from the concentrated position is initially cashed out and invested into the completion portfolio (as opposed reinvestment in the concentrated position).
Advantages: This strategy provides a hedge to the concentrated positions (albeit an indirect and weaker hedge that can be constructed using derivatives) without triggering a taxable event.
Disadvantages: It is not possible to predict with absolute certainty the correlation of the completion portfolio to the concentrated position. Past relationships may not repeat in the future. Additionally, many investors do not have access to liquid assets in an amount that would provide a meaningful hedge to the concentrated position.
Concentrated Positions – Summary
The importance of risk management cannot be overstated, especially to investors owning concentrated positions. To many investors, a true description of concentrated stock risk may sound alarmist. But to define the risk in any terms less than its true form would be doing a disservice to the investor. Many large fortunes have been lost simply because investors do not diversify.
APPENDIX I: A Primer on Value-at-Risk (VaR)
In 1988, JP Morgan began efforts to develop a single, elegant, comprehensive and easy-to-interpret- measure of financial risk, which eventually led to the value-at-risk (VaR) metric (Vozian, 2010).
VaR is expressed in three variables:
1. Amount of potential loss – Generally, this figure is a relatively large portion of the portfolio/position being measured
2. The probability1 of the aforementioned potential loss – In practice, usually 1 or 5 percent (but can be any figure between 0% and 100%)
3. Time frame – Generally shorter for traders (e.g. day) and longer for investors (e.g. year)
For example, assume for a $100 million position that VaR is measured using a year-long timeframe and a loss probability of 1 percent. VaR can be expressed in dollar as follows:
“There is a 1% chance that the position could lose $32 million or more in a single year;” or:
“We are 99% confident that the worst loss incurred in a single year will not exceed $32 million”
In practice, the VaR track record has been poor. Once-a-millennium losses (as predicted by some VaR models) were occurring regularly.
“VaR was like a faulty speedometer, which is arguably worse than no speedometer at all. If you place too much faith in the broken speedometer, you will be oblivious to other signs that your speed is unsafe. In contrast, if there is no speedometer at all, you have no choice but to look around for clues as to how fast you are really going (Wheelan, 2013).”
Why did VaR perform so poorly as a measure of risk? The short answer is many reasons, all of which related to either human misapplication of the model or structural flaws of the model itself.
One main reason is that the VaR model assumes a normal distribution of investment returns. In reality, investment returns do not follow a normal distribution, rather; investment returns follow more of a logarithmic distribution.
In the exhibit below, the left graph displays a normal distribution; the right graph displays a logarithmic distribution:
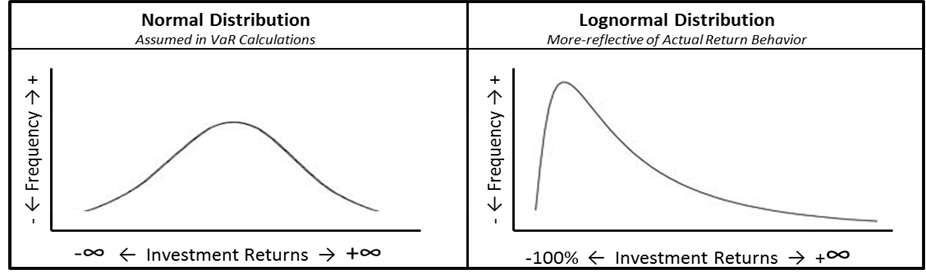
By assuming a normal distribution, VaR assumes a likelihood of “extreme” events (think Financial Crisis of 2008) to be much lower than actual1 likelihood.
Another major problem is the past performance assumption. Accepting VaR as a current depiction of investment risk – regardless of which of the three major VaR computation approaches is used – necessarily assumes that past performance will repeat in the future.
In other words, VaR can tell us about the past, however; its use as a present-day measure of risk or a forecast of future performance is severely limited by the past-performance assumption.
Efforts to improve upon VaR resulted in the development of several related metrics, including conditional value-at-risk (CVaR) and expected shortfall (ES); the details of which are beyond the scope of this paper.
APPENDIX II: Common Hedging Strategies
When hedging concentrated equity holdings, options are usually the preferred instrument. Options are less-constraining than futures contracts, as options do not oblige the buyer to perform a certain action at contract expiration (as do futures contracts).
There are two main types of options: calls and puts. Buyers of either type are never obliged to any particular action. Sellers of either type are obliged to action if the buyer decides to exercise1 the option. A call owner has a “right to buy.” A put owner has a “right to sell.” The exact price and timeframe are specified in each option contract.
There are many different types of hedging strategies, some of which can be quite complex. For the purposes of reducing investment risk of a concentrated position, two relatively simple strategies, protective puts and collars, are outlined in the table below:
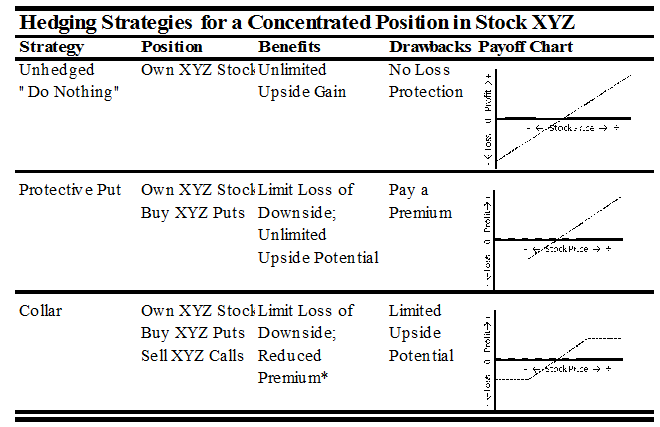
*The “premium” paid for the puts is offset by the amount received for selling the calls; the net amount can be zero or even positive depending on the respective prices of the puts and calls
Note that the execution of these strategies may be considered a “constructive sale” as defined by the IRS. Prior to execution, CPA consultation is strongly advised.
WORKS CITED
Anson, M. J. (1998). The Impact of the Taxpayer Relief Act of 1997 on Derivatives Transactions. Journal of Derivatives , Summer, 62-72.
Brunel, J. L. (2010). Low-Basis Stock: Reducing a Concentrated Exposure. In C. Institute, Level III Curriculum, Reading 17.
Shefrin, H. (2010). Heuristic-Driven Bias: The First Theme. In C. Institute, Level III Curriculum, Reading 7.
Stein, N. (2003, March 3). Fortune Magazine. Retrieved January 10, 2013, from http://money.cnn.com/magazines/fortune/fortune_archive/2003/03/03/338370/index.htm
Vozian, E. (2010, August 2). Retrieved January 10, 2014, from Global Association of Risk Professionals: http://www.garp.org/risk-news-and-resources/2010/august/value-at-risk.aspx
Wheelan, C. (2013). Naked Statistics, pg. 97. New York: WW Norton & Co.
Join the conversation
We would love to hear from you